America’s Drought hit Lakes and Rivers in Sobering Before and After Photos
The year 2022 has seen large portions of the US scorched by blazing temperatures and an oppressive mega-drought.
As of November 29, 2022, 48.1 percent of the total US and 57.51 percent of the mainland 48 states are in some degree of drought conditions, US Drought Monitor data shows. In the summer, this was drastically worse, especially across the west and southwestern states: in July 2022, one third of all land in California, Texas, Oregon, Nevada, Utah and New Mexico was classified as experiencing extreme or exceptional drought.
“This year has seen the highest percentage of the country (over 80% of the continental US) be classified as being in a drought since the US Drought Monitor was established (a little over 20 years ago),” Antonia Hadjimichael, an assistant professor in geosciences at Penn State University, told Newsweek.
These temperatures and dry conditions, which have been steadily increasing in intensity and duration over the last few decades, have hugely affected the water levels of a variety of rivers and lakes across the country. With the encroaching effects of climate change, drought and the subsequent water loss are expected to worsen over the coming years.
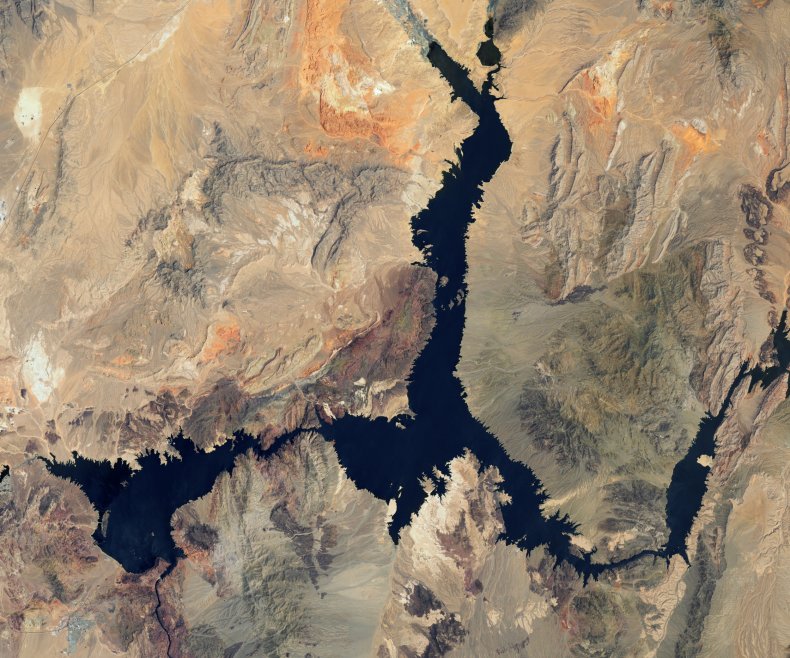
Lake Mead: 2000 vs 2022
Drag slider
to compare photos

The pictures compare how Lake Mead appeared from space in 2000 versus 2022.
Lake Mead is a reservoir of the Colorado River formed by the Hoover Dam, spanning the state border of Arizona and Nevada. The summer of 2022 saw Lake Mead experience its lowest water levels since 1937.
Since 2000, the lake has continuously broken its own lowest water records nearly every year, steadily decreasing until now. As of July 18, Lake Mead was filled to just 27 percent of its full water capacity and on December 7, the lake’s water level was 1,043.29 feet above sea level. On the same date in 2021 and 2020, the water levels were 1,065.14 feet and 1078.63 feet, respectively.
“It’s hard to know [what] future conditions might bring, but the Bureau of Reclamation produces estimates up to five years in the future, which show the Lake Mead levels are likely to further decrease (about 30 feet) in the next two years. It’s important to note that there’s a lot of uncertainty in these estimates, including in the sign of the change,” Hadjimichael said.
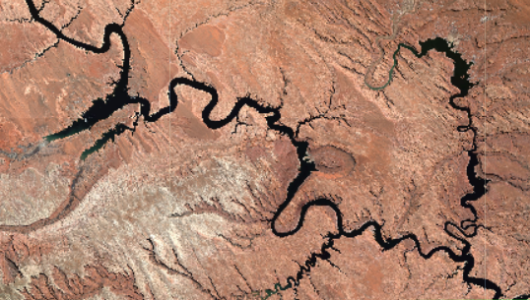
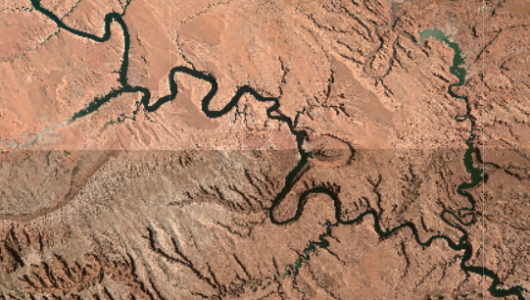
Colorado River: 2016 vs 2022
Drag slider
to compare photos

The pictures show how the Colorado River looked in 2016 and 2022.
The Colorado River is a 1,450-mile long river flowing through seven US states.
It provides water to over 40 million people across multiple US states and northern Mexico, NASA says, a large proportion of which drains from the Rocky Mountains. The river is dammed to form several important reservoirs, including Lake Mead and Lake Powell, and has also been severely impacted by the drought.
As of July 18 2022, the river was only at 35 percent capacity. The impacts of climate change are expected to further reduce the river’s flow by 10-30 percent by 2050.
“The Colorado has been in a drought for the past 22 years now, the most significant drought in 1200 years. What we’re experiencing now is in a way the cumulative result of both the exceptional magnitude but especially the duration of this drought, as reservoirs like Lake Mead have not been able to recover during this period,” Hadjimichael said. “This is actually happening to the groundwater levels in the Colorado basin too.”
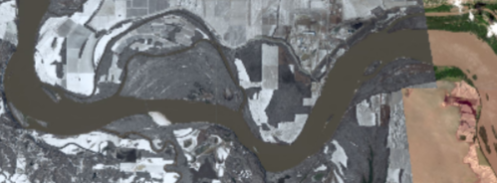
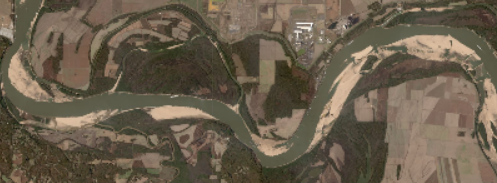
Mississippi River: 2017 vs 2022
Drag slider
to compare photos

The pictures show how the Memphis portion of the Mississippi River looked in 2017 and 2022.
The Mississippi River, which is the second-longest river in the US after the Missouri River and runs through ten states, is experiencing water levels lower than they have been in ten years. This is a problem, as the river provides drinking water to around 20 million people. Near Memphis, Tennessee, National Weather Service data showed that the water level dropped to 10.75 feet below the baseline average gauge level in mid-October.
“The Mississippi drought has mostly been attributed to the geographic reach of the drought. Being the largest watershed in the US (it covers more than 40% of the continental US) it relies on flows from a large number of basins from Montana all the way to Pennsylvania. So as opposed to normal years where some basins might be drier and some wetter, a lot of these basins have been in dry conditions these past few months,” Hadjimichael said.
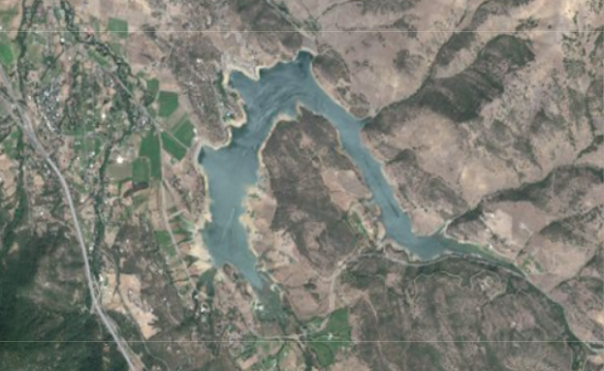
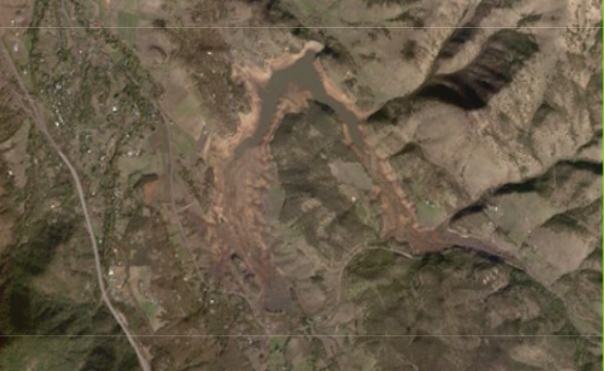
Emigrant Lake: 2016 vs 2022
Drag slider
to compare photos

The pictures show how Emigrant Lake looked in 2016 versus 2022.
Emigrant Lake in Oregon is a reservoir on Emigrant Creek—a tributary of Bear Creek—formed by the Emigrant Lake Dam.
The lake has also seen large reductions in water levels caused by the climate: it reached a mere 3 percent capacity during the drought in 2020 and 2021.
“We’re at a point now where drinking water intake at Emigrant Lake is out of water and we’ve had to work with the Oregon Health Authority to switch over to a groundwater well just to provide drinking water to the park,” Steve Lambert of Jackson County Parks and Roads told local news KOBI5 in 2021.
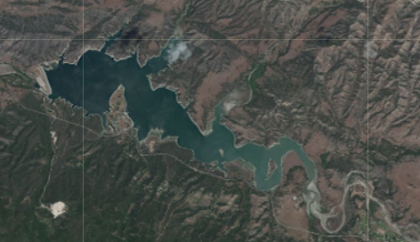
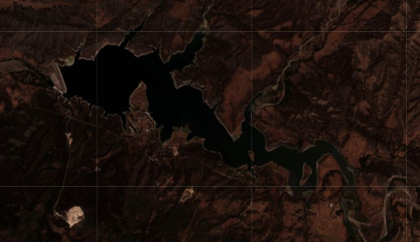
Cachuma Lake: 2013 vs 2021
Drag slider
to compare photos

The pictures show how Cachuma Lake looked in 2013 and 2021.
Cachuma Lake is a reservoir on the Santa Ynez River in California, formed by the construction of the Bradbury Dam in 1953.
As of December 7, 2022, it was 691.39 feet above sea level, its lowest point of the year so far. On the same date in 2021 and 2020, the lake was 711.4 feet and 727.98 feet above sea level.
The lake reached its lowest-record water levels in late 2016, falling to 646.42 feet, or 7.3 percent of its full capacity.
“In California we’re in a multi-year drought,” said Roger Bales, Distinguished Professor of Engineering at UC Merced and Adjunct Professor at UC Berkeley.
“We have some level of resilience for shorter droughts, one year or two,” he said. “Our climate here in the west is a mix of wet & dry years, and we have both natural and built multi-year storage. But this storage can only provide water for so long.”
“Think of having a reserve in your bank account. If your income dropped in one paycheck period, you could draw upon the reserve to continue spending at the same level. But if your income dropped in several periods, you would need to reduce expenses to keep things in balance. The problem comes when we have multiple dry years in a row.”
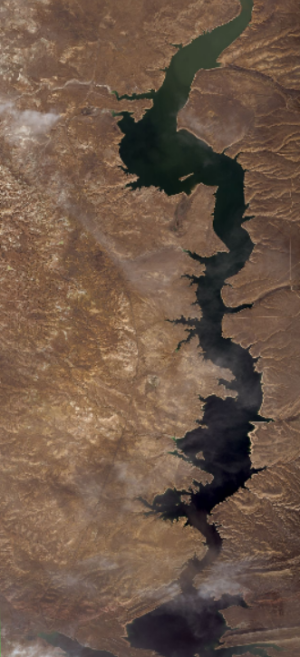
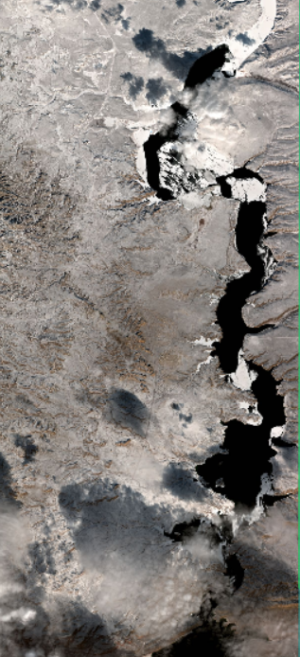
Flaming Gorge Reservoir: 2017 vs 2022
Drag slider
to compare photos

The pictures show how Flaming Gorge Reservoir looked in 2017 versus 2022.
Flaming Gorge Reservoir spans the Utah and Wyoming border, penned by the Flaming Gorge Dam on the Green River—a tributary of the Colorado River.
The reservoir is the largest in Wyoming. As of December 8, 2022, the water level of the lake is 6018.11 feet above sea level, lower than the 6025.15 feet on the same date in 2021.
All of these water bodies are important to the people of the US in some way, in providing drinking water, electricity generated by hydroelectric dams or recreation. Their steadily decreasing water levels and record-breaking lows could therefore have a large impact on the US economy.
“Decreased levels at Lake Mead have affected municipal water supplies, damaged agricultural crops, and threatened electricity production across all states that rely on Colorado River water, but especially California, Arizona and Nevada,” Hadjimichael said.
“Mississippi low levels have affected shipping and supply chains most notably, but this also indirectly affects all sectors that rely on Mississippi River transportation: agriculture (especially corn and soybeans) and industrial production of chemicals and fuels.”
These drought-caused dryings are only being exacerbated by climate change resulting from human activity, with 42 percent of soil moisture deficit between 2000 and 2021 being attributed to climate change, said a 2022 study published in the journal Nature Climate Change.
“The ultimate causes of this are pretty clear in that paper; 42 percent of the anomaly (ie the reduction in soil moisture, used as an indicator of drought) is attributed to anthropogenic climate change. Put simply, climate change is making it hotter and Drier,” Matt Telfer, an associate professor of Physical Geography at the University of Plymouth in the UK, told Newsweek.
The paper also suggests that the period 2020-2021 was the driest in the southwestern US for at least 1200 years.
As severe drought persists in the western US, federal water managers are warning some California cities that get water from the Central Valley Project to expect more drought and the possibility of an ‘extremely limited water supply’ next year. pic.twitter.com/uXYeTPI6rO
— NowThis (@nowthisnews) November 29, 2022
“Most recent estimates using regional climate models are seeing intensification of droughts across the US, especially in regions in the Midwest, Northwest and California,” Hadjimichael said. “Again, important to note here that there’s a lot of uncertainty and our ability to predict droughts is also diminished under a changing climate, as things become more variable or physical processes change, like declining snowpack. “
Climate warming is changing the water cycle in several disruptive ways.
“Warmer storms mean more of the precipitation is rain instead of snow. Mountain snow that persists in winter and melts in spring/summer provides seasonal water storage,” said Bales of UC Merced and UC Berkeley.
“Rain runs off, and must be stored behind dams or in groundwater. If we cannot store it, it will run off to the ocean, or otherwise be lost to the users that depend on it every year,” he said. “Warmer temperatures also mean earlier snowmelt, ie snow stores water for a shorter period, creating the same downstream storage problem.”
“Also, as the big snowstorms we are used to become big rainstorms in a warmer climate, we must use more of the capacity behind dams for flood control, leaving less for seasonal water storage. We also get less mountain runoff in a warmer climate, as growing seasons are longer and vegetation uses more water (wildfire and drought-induced tree mortality are feedback that partially offsets this). So it’s about quantity, timing, storage and more.”


Comments are closed.